Umbrella Product Dashboard
The Umbrella Product Dashboard provides a comprehensive view of various Umbrella metrics and usage data. This dashboard is designed to help users monitor and manage their Umbrella deployments, usage, and security activities effectively.
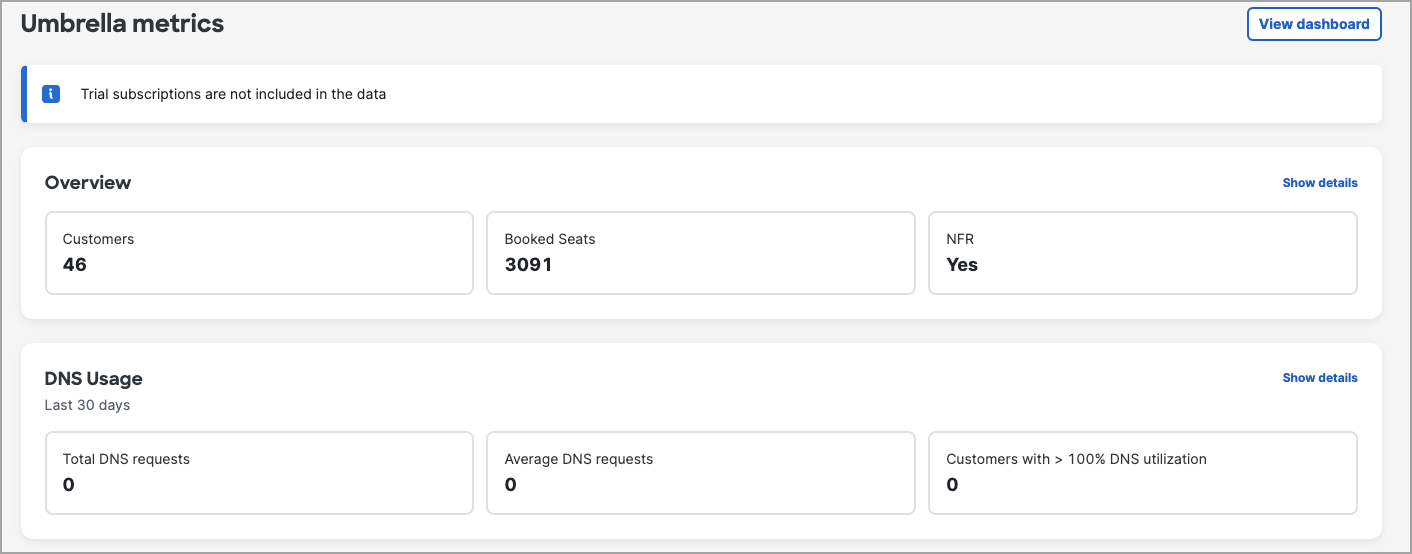
On the page, you can view detailed metrics related to the Umbrella product, access the full Umbrella dashboard for more in-depth analysis. Note that trial subscriptions are not included in the data.
Customers
-
Total Customers: The total number of customers.
-
Booked Seats: The total number of seats booked for all customers.
-
NFR (Not For Resale): Indicates whether NFR package enabled.
DNS Usage
-
Total DNS requests: The total number of DNS requests made in the last 30 days.
-
Average DNS requests: The average number of DNS requests made per day in the last 30 days.
-
Customers with > 100% DNS utilization: The number of customers who have exceeded 100% DNS utilization.

Deployment Status
-
Organization deployment health: The health status of deployments across different organizations.
-
Networks
-
Organizations with Networks
-
Roaming Computers
-
Organizations with RCs
-
Virtual Appliances
-
Organizations with VAs
-
-
Total deployment health: The overall health status of deployments.
-
Total Networks
-
Total Roaming Computers
-
Total Virtual Appliances
-

Security Activity
-
Daily breakdown: The number of security-related activities each day over the last 7-30 days.
-
Categories: The types of security threats detected. For example, malware, phishing, cryptomining, command and control, and other categories.
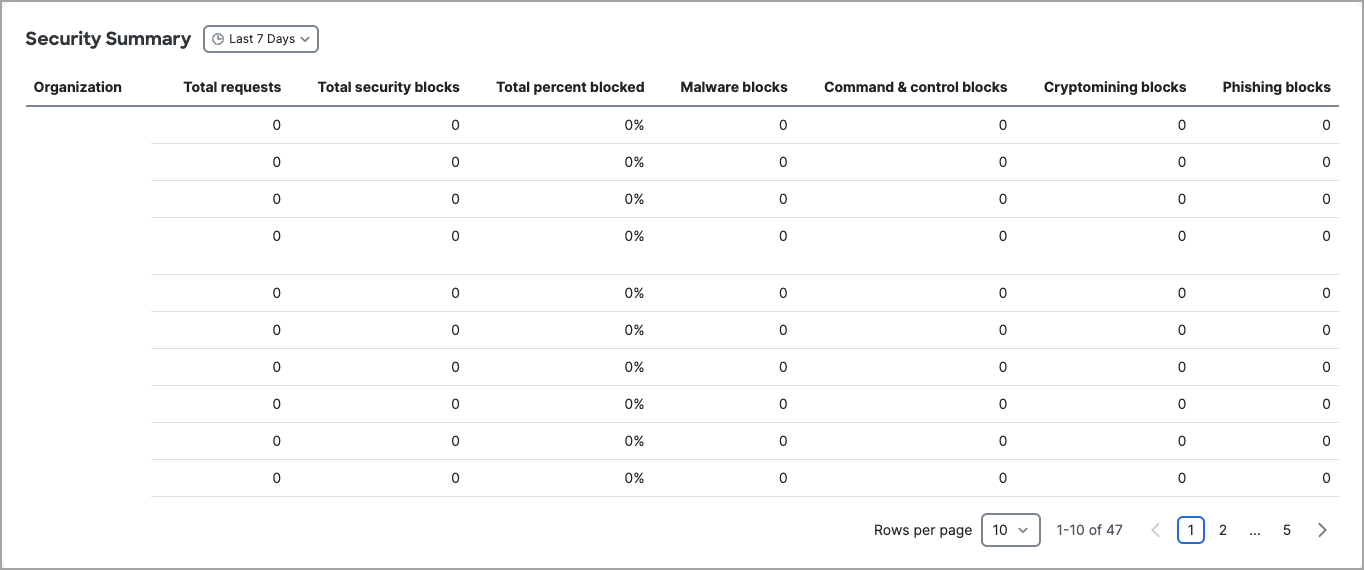
Security Summary
-
Organization
-
Total requests
-
Total security blocks
-
Total percent blocked
-
Malware blocks
-
Command & control blocks
-
Cryptomining blocks
-
Phishing blocks
